Contents
I calculate financial ROI from cash benefits and total project costs over the same period. I report hours freed separately until the company can identify the spending it will avoid or the additional contribution margin it will earn.
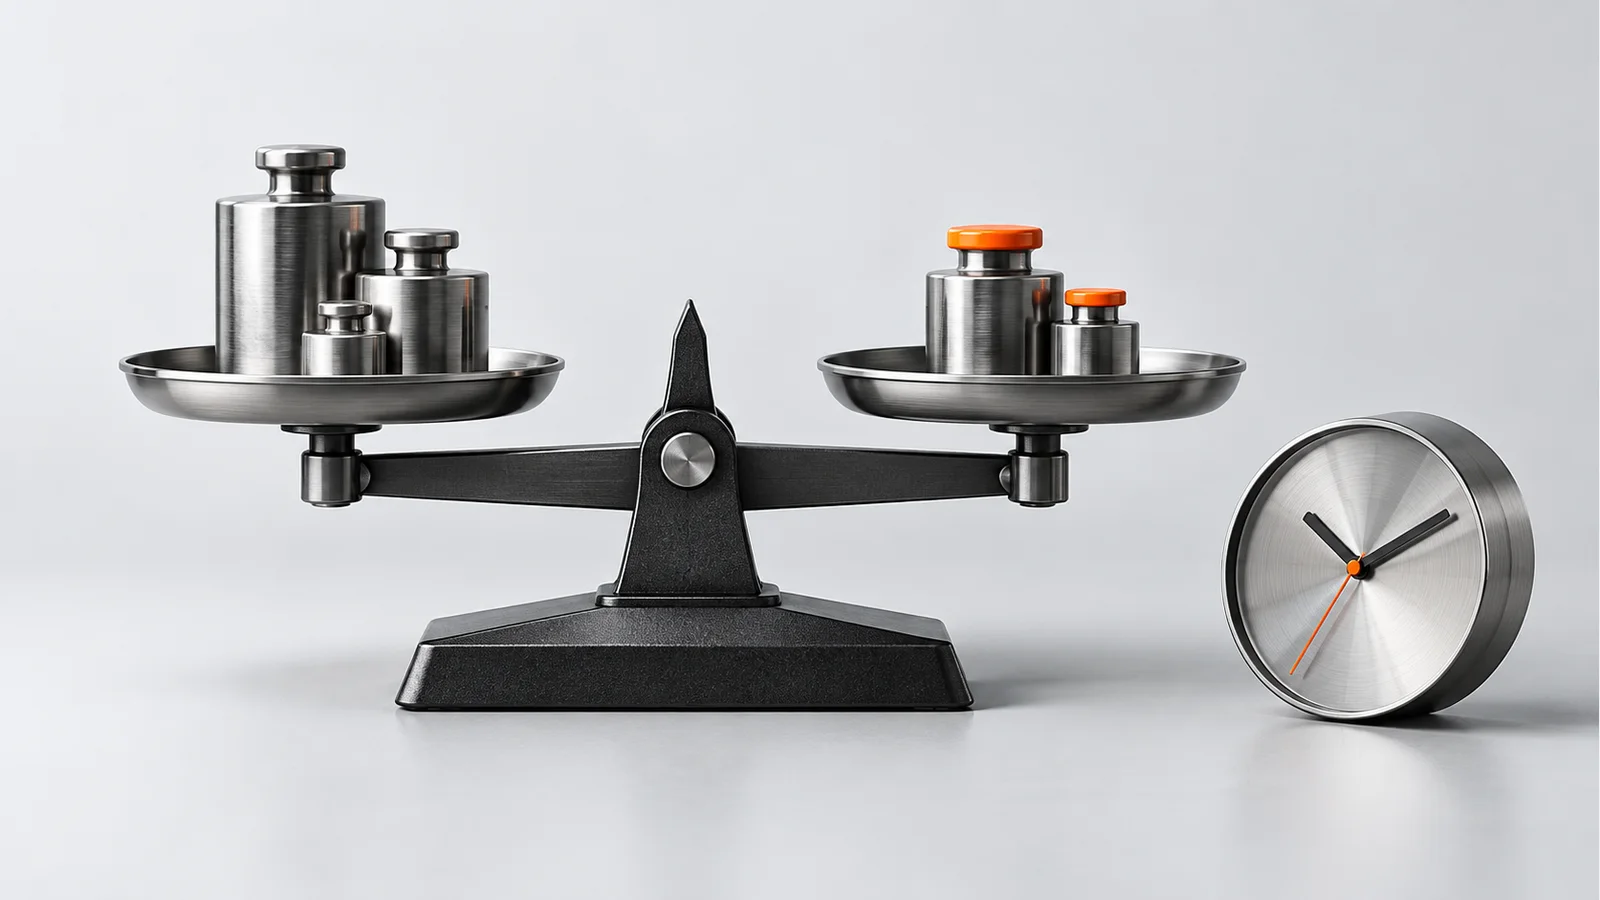
A vendor demonstrates that AI can prepare a document in two minutes. Previously, it took twenty. The CEO sees an opportunity to work faster. The CFO asks how much the company will actually save. On a slide, the answer seems straightforward: number of employees × hours freed per person × hourly labour cost.
Before accepting that calculation, check what the company will do with the time freed. Will it spend less on overtime? Reduce outsourced work? Fulfil more orders? If spending and sales stay the same, employees gain time for other tasks, but faster work alone does not increase the bank balance.
As IT Director, I was responsible for the budget and agreed investments with the board. Earlier, I initiated an RPA centre of competence: robotic process automation uses software robots to automate repetitive tasks. I set priorities with the business. With AI, I start in a similar way: with the objective, the person responsible for the outcome and a way to measure it.
Below is a method, a worked example and a sensitivity analysis. You can apply the calculation to different processes and tools; the inputs must come from the specific use case.
Five questions before an investment decision:
- What will we do with the time freed, and who is responsible for delivering the benefits?
- How long does a task take with AI, including checking and corrections?
- What proportion of tasks will actually use the tool?
- What are all the costs, including ongoing operation and project closure?
- What must the pilot demonstrate before we invest more?
Process and baseline
“Implementing AI in the company” is too broad to calculate ROI, or return on investment. Choose a process, such as preparing a quotation or checking a document. Define where a task begins and ends, and what constitutes an acceptable result.
Record the number of tasks, total working time across all people involved, error rates and error correction costs. Separate human working time from waiting time. A document prepared faster may still spend two days waiting for approval.
Compare AI with a realistic alternative: the current process, simpler automation or a change in working practices. The benefit is the difference relative to that alternative.
Financial appraisal uses future cash flows: receipts and payments that change because of the decision. ACCA explains that costs already incurred and spending unaffected by the project are excluded. Include a paid pilot when reporting the entire initiative, but separate it from future spending when deciding whether to proceed. Source: ACCA, Relevant cash flows.
Measure AI's effect in your process
How often people use AI and the proportion of responses they accept indicate tool usage. These measures alone do not establish whether the output is correct or delivers cash benefits. High acceptance may reflect good quality or insufficient checking.
To assess a pilot, I would also check a sample of accepted outputs against the source data and agreed quality criteria. The review should include outputs that users did not correct. I would record how the sample was selected, how many cases were checked and what errors were found, so that the scope of the assessment is clear.
Brynjolfsson, Li and Raymond's study, in its November 2024 version, covered 5,172 customer support agents. AI increased issues resolved per hour by an average of 15%. Effects varied: the most experienced agents saw a small speed improvement and a small quality decline. These findings concern a particular work setting. Source: Generative AI at Work, version 2.
METR studied 16 experienced developers completing 246 tasks in familiar open source projects. With early 2025 tools, access to AI made work take 19% longer, although afterwards participants estimated that they had worked around 20% faster. The sample size and type of work limit generalisation. Source: METR, 10 July 2025.
In February 2026, METR reported that participant and task selection in a subsequent study probably underestimated AI's speedup. The authors considered the data an unreliable signal of the current effect. The 2025 result should not be treated as a current forecast either. Source: METR, 24 February 2026.
Before a larger investment, I therefore suggest a pilot using a representative sample of tasks:
- Measure all human working time: preparing data, using the tool, checking, corrections and reverting to manual work when AI fails.
- Include difficult tasks and unsuccessful attempts.
- Compare similar cases at the same quality standard; where possible, randomly assign tasks to work with or without AI.
In “AI in a company without chaos”, I suggest a 6–8 week pilot and a planning card for measurement. This is a starting point: adapt the duration and sample to task frequency and process variability.
Read: AI in a company without chaos → · Pilot planning card →
Time saved and cash benefits
Time, corrections, quality and actual AI usage.
Avoided spending or additional margin. Assign an owner.
Investment, operation and timing. Then calculate ROI.
Use this formula to calculate time freed:
Hours freed per month = number of tasks × share of tasks using AI × (time without AI − time with AI) / 60
Enter times in minutes. “Time with AI” includes checking and corrections.
The AI share refers to the entire process volume. If the tool is suitable for half the cases and is used in half of those, the share is 25%. If you already enter the number of tasks handled with AI, do not multiply it by the AI share again.
Hours multiplied by the fully loaded hourly labour cost give the value of time freed. This valuation alone does not represent a cash saving.
For financial ROI, include only benefits tied to specific avoided spending or additional contribution margin:
| Benefit | What goes into the financial calculation |
|---|---|
| Less overtime or outsourced work | Spending the company will actually avoid |
| Avoided additional hiring | The cost of a credible hiring plan the company can cancel because of the project, from the planned hiring date |
| Not filling a vacancy after an employee leaves | Replacement spending avoided thanks to AI; account for effects on quality and timeliness |
| Higher sales | Additional contribution margin after variable costs, allowing for demand and delivery capacity |
| Fewer errors | Reduction in error count × avoided cost per error |
| Time freed with unchanged spending and sales | Hours and their value, reported separately from financial ROI |
First calculate avoided spending at actual rates. The percentage of the value of time that becomes cash savings, called the time savings realisation rate below, is a shortcut for comparing assumptions. It does not replace a plan to reduce spending. Additional sales margin can be calculated separately.
For reductions in scrap, downtime or inventory, calculate financial effects directly. Separate a one-off release of cash from inventory from recurring savings and any lost margin caused by stockouts. Enter each item once, in the period in which it occurs.
Do not count the same hours as both payroll savings and a source of additional margin. If correction time is already included in task time, do not add it to the cost per error again. Include only other consequences, such as reshipping or a customer refund.
Costs across the full period
A subscription is only part of the project cost. Prepare two lists:
| At the start | During operation |
|---|---|
| Process analysis and data preparation | Licences and model usage fees |
| Integrations, configuration or development | Hosting, storage and infrastructure |
| Quality and security testing | Integration maintenance and monitoring |
| Training and changes to working practices | Additional oversight, exceptions and incidents |
| Internal implementation work | Retesting after tool changes |
Include planned exit costs: migration, data export, disabling integrations or moving to another solution.
Report existing employees' work as a commitment of resources. Add project-related payments, cover costs or contribution margin lost from other work to cash flows. Valuing an employee's hours does not create additional spending if their pay stays the same.
Set a budget for quality and security controls. NIST describes risks including confidently stated incorrect AI answers, privacy risks and information security risks. It helps identify safeguards, but does not prescribe a percentage “risk cost”. Source: NIST AI 600-1.
Calculate ROI, payback and NPV
Choose a period first: for example, 12, 24 or 36 months. All costs and benefits must cover the same scope and period.
ROI = (financial benefits − project costs) / project costs × 100%.
Here, costs include both the initial investment and operating costs during the chosen period. ROI of 30% means that the surplus over costs equals 30% of those costs. It does not mean that total company profit grows by 30%. Always state the period: three-year ROI is not an annual rate.
Payback tells you when cumulative benefits cover cumulative costs. With a constant positive monthly surplus and benefits starting in month one, this approximation can be used:
Payback = initial investment / (monthly benefits − monthly operating costs).
For phased deployment, calculate cash flows month by month. If the investment does not pay back within the selected period, report that result. Do not present a distant date as certain.
NPV, or net present value, converts future receipts and payments into today's value using an agreed discount rate. It helps compare projects with different schedules. Source: ACCA, Investment appraisal.
The following formula assumes an investment today, cash flows at month end and an effective annual discount rate. Net cash flow is benefits less that month's costs.
NPV = −initial investment + sum [net cash flow in month m / (1 + effective annual discount rate)^(m/12)].
Sum all months in the analysis. Positive NPV means that the project covers costs and the required return under the stated assumptions.
Agree the rate with finance. Reflect forecast price changes consistently in cash flows and the discount rate. Also keep the pre-tax or post-tax basis consistent. Source: ACCA, inflation and taxation in investment appraisal.
ROI and how time is used
The following figures are a hypothetical calculation. They are not from one of my projects, are not a price list and do not represent market averages.
A company handles 3,000 repetitive tasks per month. Total human working time per task falls from 18 to 10 minutes. AI is used in 80% of all tasks. Benefits and costs in this example remain constant from month one.
| Assumption | Value |
|---|---|
| Initial investment | PLN 60,000 |
| Monthly operating cost | PLN 6,000 |
| Fully loaded hourly labour cost used to value time freed | PLN 75 |
| Avoided overtime spending | 80 h × PLN 90 = PLN 7,200 per month |
| Avoided outsourced work | 60 h × PLN 120 = PLN 7,200 per month |
| Error rate in AI tasks, before / after implementation | 3% / 2% |
| Avoided cost of other consequences per error, excluding labour already included in task time | PLN 120 |
| Analysis period | 12 months |
| Effective annual discount rate, for this example only | 10% |
Time freed is 3,000 × 80% × (18 − 10) / 60 = 320 hours per month, valued at 320 × PLN 75 = PLN 24,000.
The company uses 140 of these hours to reduce paid overtime and outsourced work. At the rates in the table, it avoids 7,200 + 7,200 = PLN 14,400 per month. It can use the remaining 180 hours for other tasks.
The time savings realisation rate is 14,400 / 24,000 × 100% = 60%. This is a share of monetary value, not of hours. In a real project, the spending reduction plan must be confirmed with the process owner.
AI covers 3,000 × 80% = 2,400 tasks per month. Reducing errors from 3% to 2% means 24 fewer errors and 24 × PLN 120 = PLN 2,880 saved. Correction work is already included in task time. Better quality is an assumption that the pilot must validate. More errors would create additional cost.
Total financial benefits are 14,400 + 2,880 = PLN 17,280 per month. After operating costs, the surplus is 17,280 − 6,000 = PLN 11,280.
| Result over 12 months | Value |
|---|---|
| Financial benefits: 12 × PLN 17,280 | PLN 207,360 |
| Costs: PLN 60,000 + 12 × PLN 6,000 | PLN 132,000 |
| Surplus over all costs | PLN 75,360 |
| ROI: PLN 75,360 / PLN 132,000 × 100% | 57.1% |
| Approximate payback: PLN 60,000 / PLN 11,280 | 5.3 months |
| NPV at the illustrative 10% discount rate | approx. PLN 68,600 |
Payback of 5.3 months assumes benefits and costs accrue evenly. With settlement only at month end, the balance becomes non-negative at the end of month six. NPV uses PLN 60,000 invested today and twelve month-end cash flows of PLN 11,280. The 10% rate is an illustrative assumption, not a recommendation.
Now change only the time savings realisation rate. AI still covers 80% of tasks; all other assumptions remain the same:
| Time savings realisation rate | Monthly benefits, including fewer errors | ROI over 12 months |
|---|---|---|
| 20% | PLN 7,680 | −30.2% |
| 30% | PLN 10,080 | −8.4% |
| 40% | PLN 12,480 | 13.5% |
| 60% | PLN 17,280 | 57.1% |
Same time saved. Different financial result.
Hypothetical guide example · 12 months · AI usage: 80% of tasks
Under these assumptions, the 12-month break-even realisation rate is about 34%. ROI is positive above that threshold. This is a result of this example: changing costs, error benefits or the analysis period changes the threshold too.
AI's speed stays the same across these cases. What changes is how the company uses the time freed. Here, that assumption matters more than the tool demonstration itself.
Check deployment timing and risk
Prepare three scenarios: cautious, base and favourable. Vary the assumptions that most influence the result: AI task share, total task time, realisation of financial benefits, usage costs and deployment speed. Base ranges on pilot data, quotations or specific constraints. Scenarios show possible outcomes under different assumptions; they do not assign probabilities.
In the example, assume AI covers 40% of tasks in month one, 60% in month two and 80% from month three. Keep the time savings realisation rate at 60%. Assume avoided spending and error benefits grow proportionally with AI usage; costs stay unchanged.
Benefits are then PLN 8,640 in month one, PLN 12,960 in month two and PLN 17,280 in each of the next ten months. This gives PLN 194,400 in the first year and reduces ROI to 47.3%. The result remains positive, but is lower than with full benefits from the start.
Also check circumstances that could stop the project:
- Quality is too low.
- Data use is unacceptable.
- Nobody is responsible for checking results.
- The solution cannot be withdrawn.
A positive ROI does not remove these risks.
If you have a credible basis for estimating an incident's probability during the analysis period and its cost, you can show expected loss as their product. Without evidence, describe the risk and calculate a contingency scenario. Do not insert a random percentage to make the calculation look complete.
When should you decide to implement?
Before the pilot, speak with the business and finance. Agree the criteria for further investment: acceptable quality, budget, maximum payback and how benefits will be confirmed. There is no single ROI threshold suitable for every company.
Scaling makes sense when measurement confirms the effect, costs include oversight and the result meets the agreed criteria. The process owner should identify specific sources of financial benefits. If the calculation mainly values hours, tell the board clearly and prepare a plan for using them.
Considering an AI investment? Write about the process you want to improve and its biggest cost today. During a free conversation lasting up to an hour, we can discuss the objective and the data needed to assess the project.
Let’s discuss your project
About the author
I have more than 20 years of experience in IT. As IT Director, I was responsible for systems, infrastructure, security, the budget and vendors. I advise companies on IT and am looking for a permanent IT leadership role, preferably in manufacturing.
Sources and calculation assumptions
Sources checked on 10 October 2026. Studies concern specific applications and tools; their findings are not default calculator inputs. The formulas, benefit categories and numerical example are a proposed analysis method. The example excludes taxes, price changes, working capital and project closure costs. Include these in a real project if they affect cash flows.
- Brynjolfsson, Li, Raymond: Generative AI at Work, 6 November 2024 version
- METR: Measuring the Impact of Early-2025 AI on Experienced Open-Source Developer Productivity, 10 July 2025
- METR: We are Changing our Developer Productivity Experiment Design, 24 February 2026
- ACCA: Relevant cash flows
- ACCA: Investment appraisal
- NIST: Artificial Intelligence Risk Management Framework: Generative Artificial Intelligence Profile, NIST AI 600-1, July 2024