
Contents
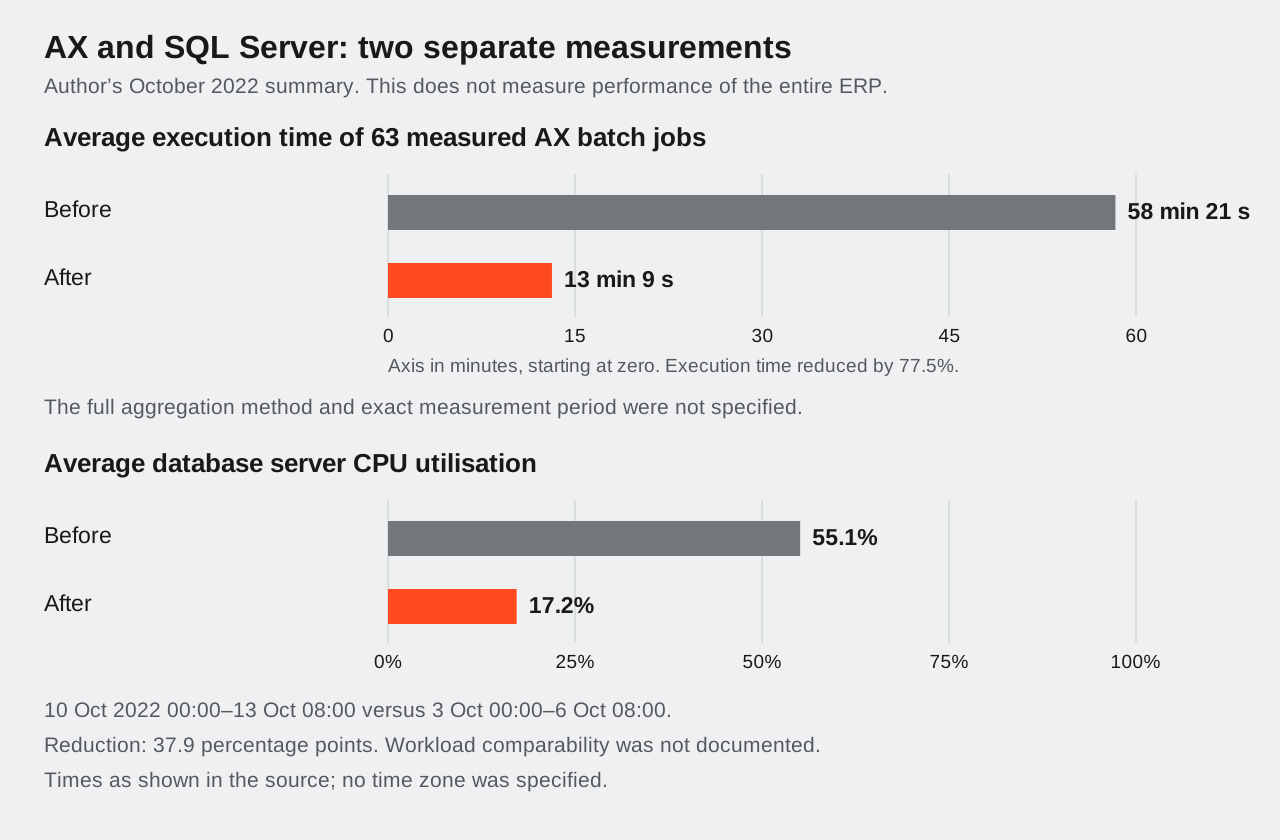
After the optimisation work I carried out on Microsoft Dynamics AX and SQL Server, the average execution time of 63 measured batch jobs fell from 58 min 21 s to 13 min 9 s. This result comes from my October 2022 summary and applies to that set of jobs, rather than the performance of the entire ERP system.

Slow ERP and production work
At an international automotive group, slow responses and freezes in Dynamics AX affected daily work. Users waited for operations to finish. Some tasks required overtime, and system problems also caused production downtime.
The batch jobs responsible for Master Scheduling were particularly important. They processed the information needed to prepare the production plan. When they failed to complete correctly or on time, the plan was incomplete or unavailable.
To assess the changes, I therefore needed to consider both the IT environment and the operations people relied on to do their work.
My role and scope of work
During the work summarised in 2022, I was IT Systems Manager. I carried out the technical optimisation work myself. I involved key users in performance testing: people from the business who knew the system and their departments' processes well.
These activities continued a project from 2020. The results in this article come from the October 2022 summary; they do not describe a project running continuously throughout that period.
The work covered Dynamics AX 2012, the SQL Server database, application servers, batch jobs and overnight processing for reporting and the data warehouse.
Establishing a baseline
I started with a technical audit and established a performance baseline. This gave me a reference for assessing subsequent changes.
I analysed query execution times and the load they generated, logical reads, execution plans, active sessions and blocking. I checked indexes, how up to date the statistics were, their sampling and table sizes. I also reviewed the application configuration and network traffic.
Next, I reviewed the settings against best practices. Some parameters needed testing in our environment, including MAXDOP and buffer size settings.
In each test, I changed one parameter, collected measurements, compared them with the baseline and recorded the results. I used this evidence to select a set of settings suited to our environment.
Database and application changes
I worked across several connected areas. I optimised SQL queries and stored procedures, indexes and statistics, as well as selected Dynamics AX customisations and interface components that generated substantial load.
I changed batch schedules and parameters. The work also covered overnight processing for Business Intelligence, including reporting and data analysis, and the data warehouse. I optimised queries used in the integration between AX and the Manufacturing Execution System (MES).
I reviewed and improved the AOS configuration: the Dynamics AX application servers. I also examined network traffic. The work covered different parts of the environment, so the final measurements do not allow the entire improvement to be attributed to a single setting.
Data archiving agreed with the business
I agreed the scope and frequency of data cleanup and archiving with business units, particularly finance. I used standard AX mechanisms and created additional automated routines in SQL Server Agent and SQL Server Integration Services (SSIS).
When working on InventDim inventory dimension data, I considered references from AX tables and the organisation's customisations. This account is not an instruction for cleaning up data in another environment: dependencies and business requirements need to be checked for the specific system.
Monitoring and user testing
I created automated routines to collect data on 10 key system operations. Monitoring enabled a more proactive approach to performance. Key users took part in testing, so we also assessed the operations they performed in their daily work.
Those 10 operations are separate from the 63 batch jobs whose average execution times are shown below.
AX and SQL Server results
In my October 2022 summary, I presented four comparisons. Each relates to a specific function or metric.
63 batch jobs58 min 21 s → 13 min 9 s
Average CPU load55.1% → 17.2%
Separate metrics and measurement scopes; not a result for the entire ERP.
| Metric | Before | After | Measurement scope and limitation |
|---|---|---|---|
| Average execution time of 63 measured AX batch jobs | 58 min 21 s | 13 min 9 s | The summary does not describe the full aggregation method or exact measurement period. The result applies to this set of jobs. |
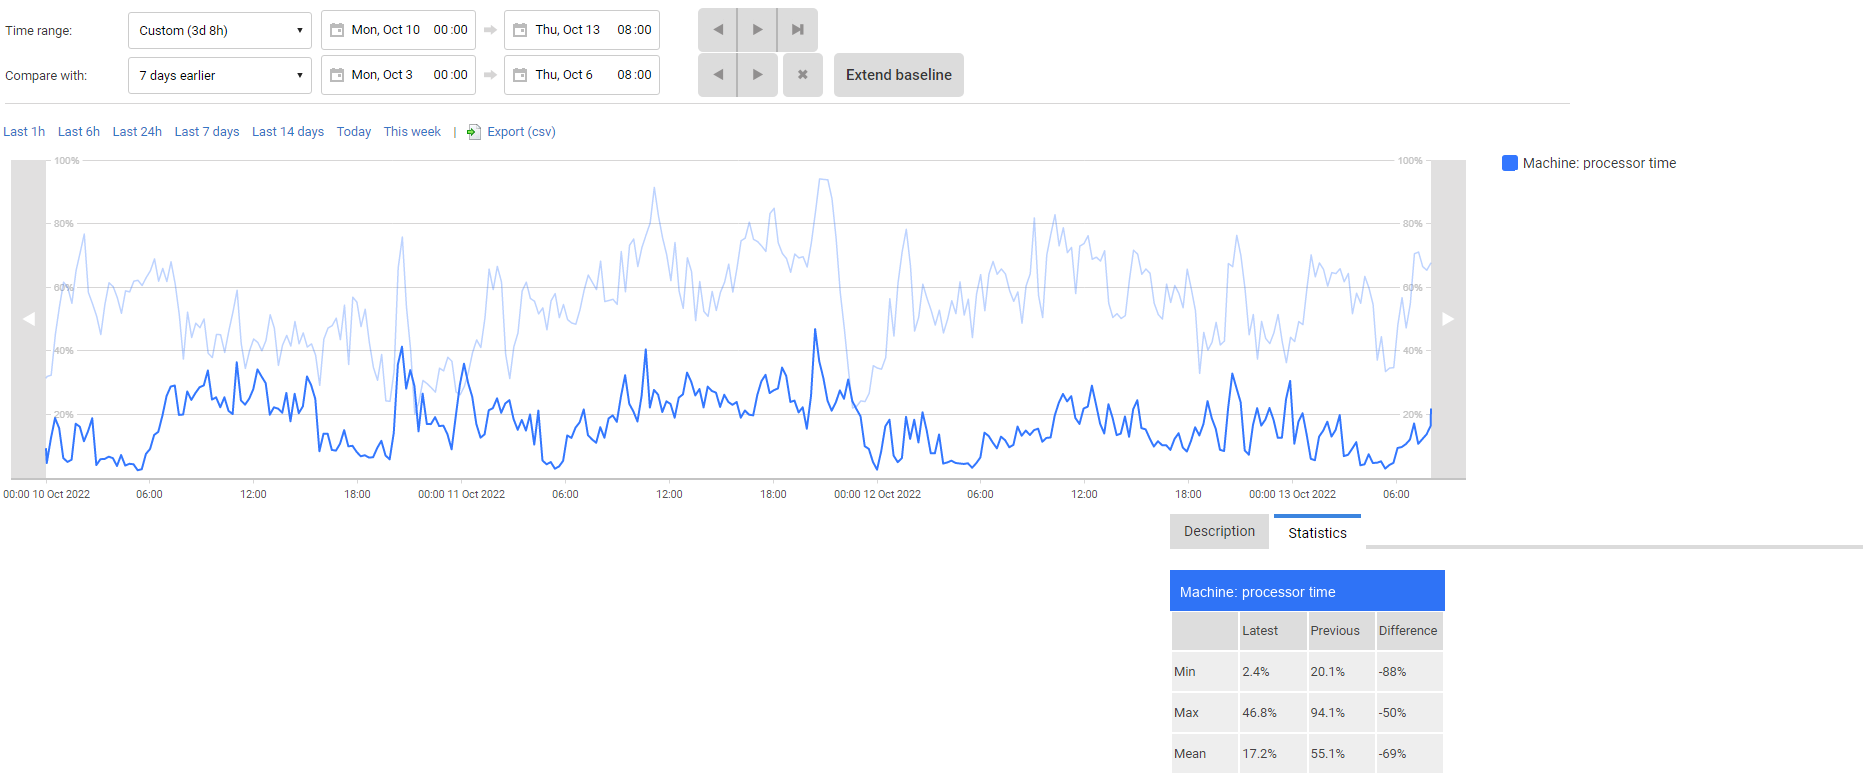
| Average database server CPU utilisation | 55.1% | 17.2% | Comparison of 10 October 2022 at 00:00 to 13 October at 08:00 with 3 October at 00:00 to 6 October at 08:00. Times are as shown in the source screenshot; no time zone is specified. The comparability of the business workload was not documented. |
| Time to open a selected AX form | 10 min | 3 s | The result applies to one form, not every screen in the system. |
| SQL deadlocks in production planning | more than 100 per day | fewer than 10 per day | The summary does not specify the observation period. The result does not mean that all blocking was eliminated. |
Source: my October 2022 summary of AX performance work, slides 12, 16 and 18. The data is presented anonymously, without infrastructure identifiers.
The change in average job duration represents a reduction of approximately 77.5%. This is a reduction in execution time for the specified set of jobs, not a measure of improvement across the entire ERP system. Average CPU utilisation fell by 37.9 percentage points over the compared periods.
I do not use these figures to calculate financial savings or staff hours recovered. A job's execution time on a server does not establish how much employee time was saved.
Effects for users and IT operations
Users in finance, production planning and purchasing reported a better working experience. There were still reports of isolated slowdowns and problems with remote access.
The optimisation work and monitoring supported stable operation and helped prepare the environment for a higher workload. These are qualitative outcomes: I do not report a percentage increase in user satisfaction or a measured improvement in scalability.
A separate result is that there were no critical ERP outages during 2021–2024 in the area I managed. Here, a critical outage means the system stopping across the whole group or in a key area. This was a team outcome over that period; the optimisation work and monitoring described here formed part of that work. It does not mean there were no incidents or that every system function was continuously available.
Assessing a similar problem
This project shows the importance of a baseline and a clearly defined result. Before choosing changes, it is worth establishing which operation is disrupting work, when the problem occurs and what data will allow the outcome to be assessed.
“AX is slow” is a starting point for a conversation. Naming the operation, its execution time, when the problem occurs and its effect on the business process makes that conversation more specific. The outcome of one project is not a forecast of improvement in another environment.
Sources and scope of this account
This account is based on my October 2022 summary and the scope of work I have confirmed. Retained technical materials provide further evidence of the diagnostic methods; the scripts themselves do not measure the improvement achieved. The data relates to one environment and the operations described here.
About the author
Rafał Mokrowiecki. I have more than 20 years of experience in IT, from ERP programming to the role of IT Director. I now advise companies; Dynamics AX 2012 and SQL Server are the technologies I know best. See my experience and responsibilities.
Which AX operation is taking too long? Tell me what you are doing, when the problem occurs and how it affects your business. This is a starting point for discussing the scope of a diagnosis. IT advisory for companies.